


Key Performance Indicators (KPIs) are critical metrics used by CEOs and managers to assess the state of their company or project, and take them to the next level. They are metrics that you collect and analyze carefully to keep track on your business progression, and they should produce actionable insights both internally and externally. Monitoring your business thanks to the right selection of KPIs is important so that you can measure your targets reach, strengthen accountability, and achieve goals in stages, giving space for positivity and motivation when global targets are too large to keep the moral up in the short-term. Besides, if you also abide by the “what is not measured cannot be improve” maxim, KPI tracking is made for you.
The main pitfall you should avoid, however, is to collect an incredible amount of data and start drowning in. Many managers are so eager to get the most insights possible that they can miss the most important ones, buried under a mountain of metrics piling up.
I will here pick five important indicators related to five main categories, from finance to human resources, to take the global pulse of a business. This is of course a non-exhaustive list: you should determine which factors really drive your business, and dress a list of KPIs accordingly!
Marketing performance
Return on Investment (ROI)
One of the key metrics to assess the efficiency of the money you spend, especially for the marketing department, is the Return on Investment. Who wants to keep supporting an activity when it is just wasting money? The marketing ROI, sometimes called the Return on Marketing Investments measures how much money generates a campaign regarding the investments made to launch and run it.
The ROI will help you in evaluating which marketing campaign or channel is working better, and adjust when and where needed. To calculate the marketing ROI, Investopedia provides us with the following formula:
ROI = (Sales growth – Marketing investments) / Marketing investments.
It is usually expressed as a percentage. The higher the ROI, the better is the campaign.
You can read here another example on how to calculate your marketing ROI, and they take it a step further by involving the Customer Lifetime Value and Investment Per Acquisition into the formula, but I will keep it simple and give you an application of the formula detailed previously:
Let’s say you launched a campaign that cost you $5000, and you saw your sales grow by $6000 after launching it. Your ROI will then be of (6000-5000)/5000 = 20%.
It can be quite challenging, however, to relate “the right return to the right campaign”, since in today’s digital businesses there often are several campaigns at the time through various channels. I would then suggest you to collect the data from various sources (Google Adwords, Google Analytics, CRM platforms and other business intelligence tools) and find trends over time.
Sales Performance
Sales Growth | Sales Target
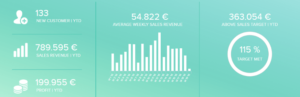
Sales growth is measuring the rhythm of increase (or decrease) in the sales revenue. This is a crucial indicator for sales leaders as it will show whether they reached their goals or not, and how well their teams are doing. It is important to measure such KPIs over several periods of time so as to compare it and find potential trends, and how and why sales are performing better at this period more than this one. Paralleling it with other KPIs such as the marketing ones can inform you even more on the whys and hows of your sales trends. For instance, each time you launch a new Google Adwords or PR campaign, you may notice an increase in leads that are converted into sales: making this kind of connection will enable you to repeat the same successful actions in the future.
A positive sales growth over a specified time period tells you that you are running the sales correctly. That KPI can also be broken down into several metrics to focus on one specific sales team or person. That way, you are more able to evaluate if they are performing well enough and reach (or exceed) their sales targets, or if those targets are maybe beyond reach.
That brings us to the second KPI measuring sales performance: the targets. Are you on track with what you have planned, do you need to adjust or redefine your strategy, or keep it that way? This is a vital metric for forecasting and strategic decision-making. To know if you are doing well, you should assess your current revenue versus the forecasted revenue, and that number should be exceeded.
Understanding Your Customers
Customer Lifetime Value (CLV)
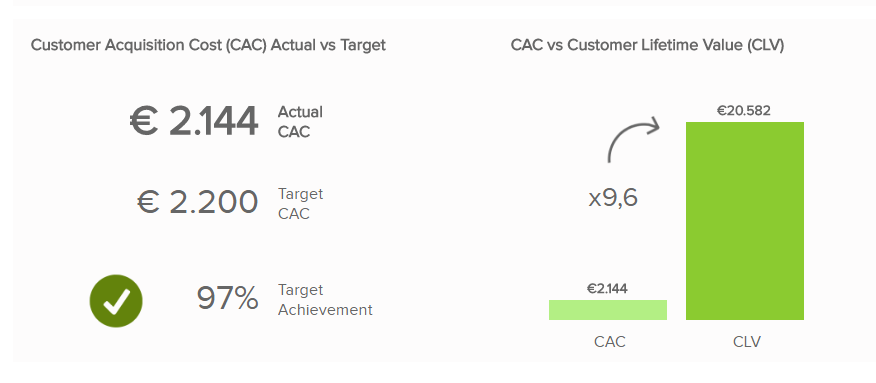
Put it simply, this is the amount of money you would expect to make from that customer over the lifetime of your relationship. Even if it can be a bit intimidating to determine how much your customers are worth to you, you still need to evaluate it. That will help in strategy-planning and also in assessing your current sales performance: the longer you keep paying customers, the more money you will earn. Vital design gives us this formula to calculate the CLV:
CLV = Revenue x Gross Margin x Average Number of Repeat Purchases
As we have seen above, the Revenue is the money your company makes during a certain period of time, while the Gross Margin is the percentage of total revenue before deducting all the expenses and taxes. The Average Number of Repeat Purchases can be removed if our company does not earn recurring revenue from recurring purchases.
Let’s take an example: you are a fashion retail company selling sports shoes that cost $75. Your gross profit margin on those shoes is 53%, and one of your loyal customer buys on average 5 pairs over the course of the relationship. The lifetime value of that customer would be : $75 x 53% x 5 = $198,75.
To maximize this metrics, you will have to work on your customer loyalty and retention. That refers to the attraction of the right customer via the right channel, make them buy on a regular basis and in bigger quantities, and making them bring even more customers.
To avoid customer churn, you should also get to know them. This is possible by studying their behaviour through various evaluation methods: direct feedback, satisfaction surveys, online behaviour analytics, and understanding the customer journey. McKingsey explains how to make the best out of that customer journey (focusing on B2B sales), mapping it by customer segment and encouraging marketing and sales team to work hand in hand all along the journey.
Finally, you should also be aware of the Cost of Customer Acquisition (CAC) that shouldn’t be too high. That cost refers to the money invested to get a prospect turned into a customer and can be calculated dividing the Total of Marketing and Sales Investments by the Number of Customers Acquired. If you have invested $5000 in your marketing and sales campaigns and it brought you 8 customers, your CAC= 5000/8= 625 $. The final goal is to decrease that value while increasing the CLV, so as to keep your business healthy.
Financial Performance
Gross Profit margin | Net profit margin
The Gross Profit Margin measures the profit made on each dollar of sales, before expenses. Usually calculated as a percentage, it determines the effectiveness in keeping control over your production costs:
Gross Profit Margin = (Revenue – Costs of goods sold) / Revenue
The higher is your gross profit margin, the more money is left to take care of the operating expenses and net profit. A gross profit margin of 63% means that your business manages to keep 63 cents out of every dollar earned. Such profit would be then used to take care of administrative costs, marketing costs, etc.
So, be careful not to mix Gross Profit Margin and Net Profit Margin: the latter is the one referring to whether your company is actually making profit or not.
The Net Profit Margin is measuring the profit after subtracting all the operation expenses, interests and taxes, that you divide by the total revenue:
Net Profit Margin = (Revenue – Total Expenses) / Revenue
Expressed as a percentage as well, this is the KPI most looked after in finance departments, as it shows how good your company is at cost control, and how effective it is at turning revenue into profits. It represents the amount of each dollar of revenue turned into total net income.
If you have a low profit margin, the risks are higher: any drop in sales can affect your business and turn the profits into losses.
Understanding Your Employees & Their Performance
Employee Engagement | Retention Rate | Absenteeism
To conclude with, I will finish with a KPI which is not always a proper “metric”, but still has a high importance. Human Resources have evolved over the past decade, from a more “service and administrative” oriented department to an important and strategic division. The terms of “Chief Happiness Officer” or “Jolly Good Fellow” started to pop up in numerous companies, and the well-being of employees is now relatively more important – especially after dozens of studies about happiness at work and burnouts at the same place have shown how it impacted productivity. Many people are today in charge of evaluating the workers well-being and satisfaction, fostering a certain culture and creating the right conditions for employees to feel better than just anonymous numbers in more or less opened cubicles that the 90s “rationalizing” era brought.
The questions you should ask yourself concerning your employees’ engagement are, as Inc. magazine explains, the following ones: how are my employees feeling when they arrive at the office, dragging feet or more enthusiastic? Are they aligned with the company mission, do they relate and are ready to even share it?
These KPIs are often the hardest to evaluate, collect and consolidate; yet, they are needed if you care a minimum about your company and how to push it forward, retain your employees, keep them happy so that their productivity level is higher, but also in order to attract the best candidates in the future.
A way to do it for instance, is to distribute anonymous surveys or do them online so as to take the temperature of employees’ satisfaction at work.
Another more “down-to-earth”, measurable KPI is the retention rate over a certain time period: how many of the employees hired in January 2016 are still here in January 2017, and why did some of them leave? A high employees turnover tells a lot about their satisfaction in your company.
Finally, the absenteeism rate is also very eloquent about how your employees are feeling and it will also give you an idea of the amount of productivity and work your company lost because of sick leave (or unannounced leave). You can calculate it as follow, and visualize it as a percentage:
Absenteeism rate = Total number of absence day per employee / Total number of working days.
The culture of a company helps a lot in fostering a good environment for everyone at the office. A transparent vision, sharing goals, objectives and the global strategy with employees increases their level of engagement because they feel like a valued member of the team and trusted. It builds motivation and retention at the same time, both highly important to achieve and exceed the various targets and goals set.
In today’s digital age, choosing which KPI to measure can feel overwhelming. By assessing what are your company’s needs, you can set up a list of some priority metrics to track and monitor, using the list provided here as a first help!

Mona Lebied
Latest posts by Mona Lebied (see all)
- 5 Golden KPIs Every Company Should Monitor To Improve Further - February 9, 2017